
Data visualization / finance · Video
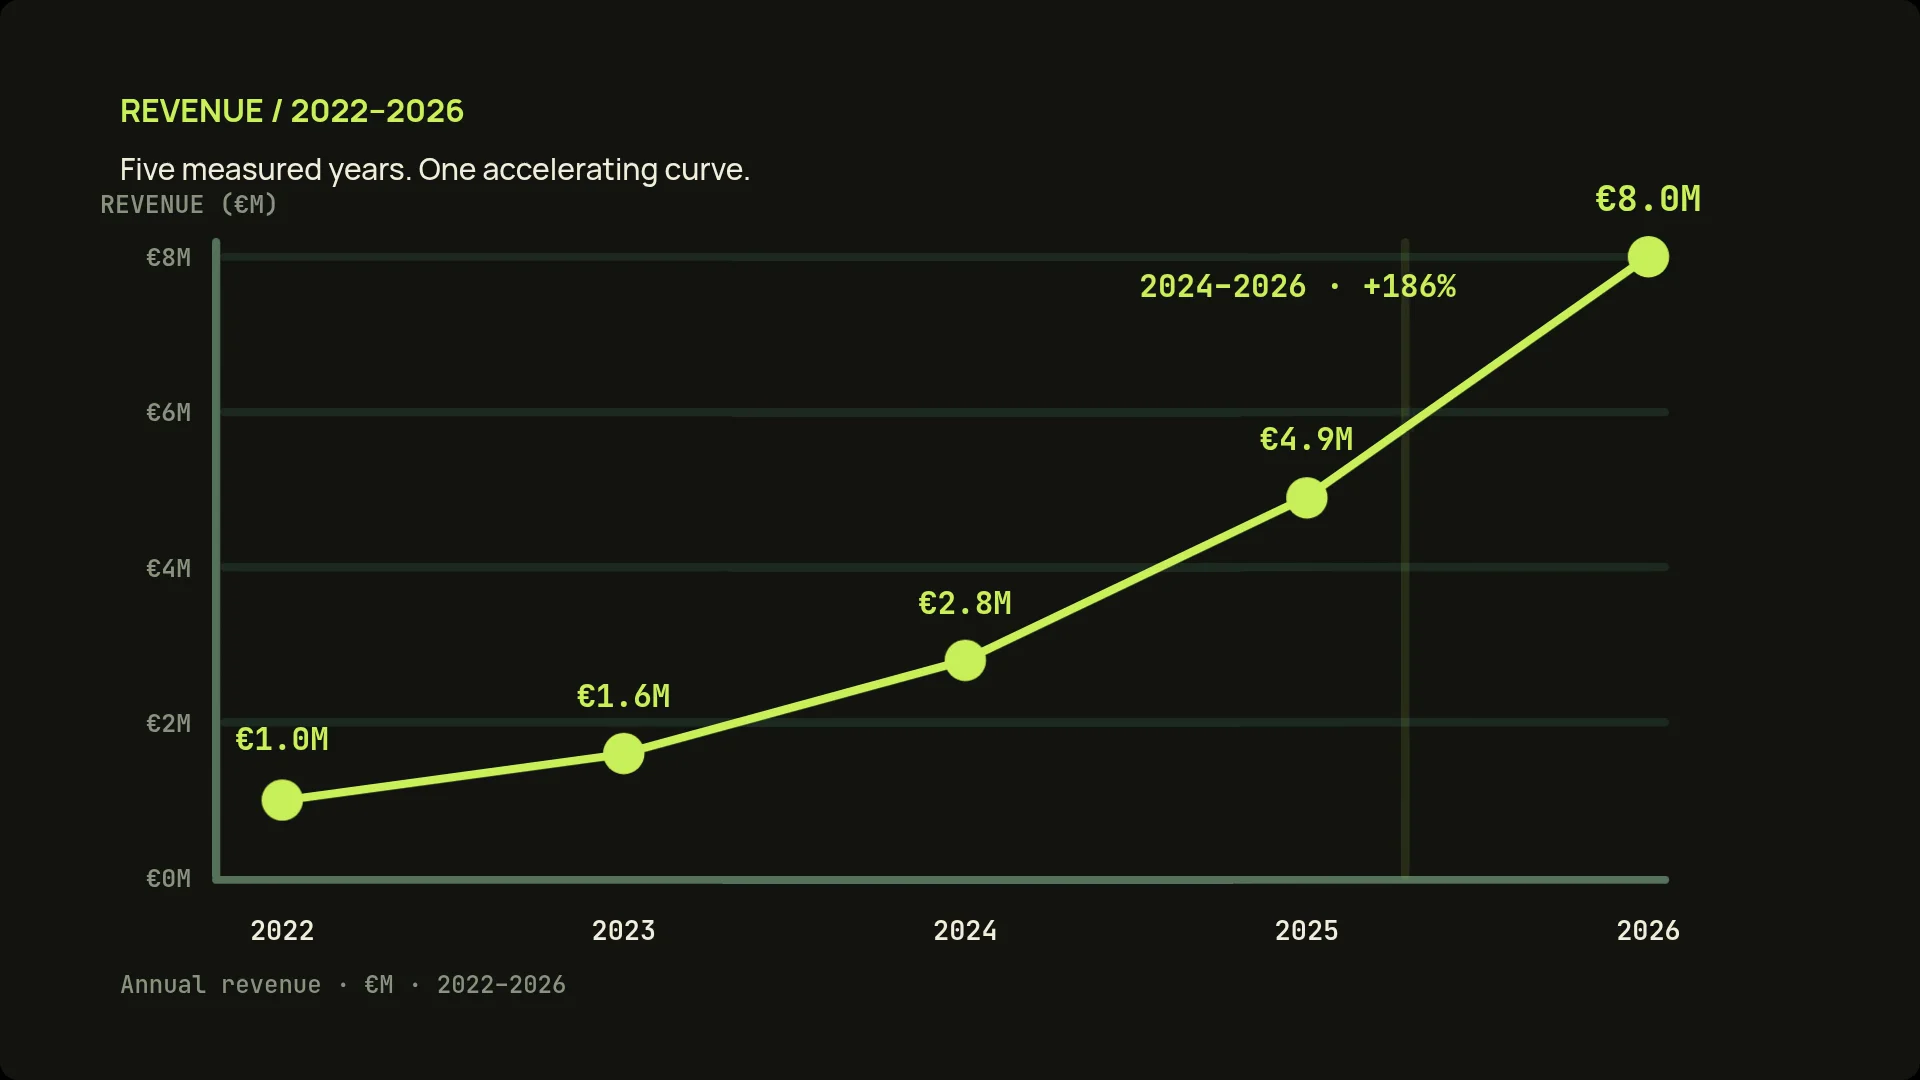
Revenue Growth — 2022 to 2026
A single measured time series builds from €1.0M to €8.0M, using a precise animated curve, restrained annotation and a focused acceleration story.
WHAT IT SOLVES
A finished visual source you can still change.
A single measured time series builds from €1.0M to €8.0M, using a precise animated curve, restrained annotation and a focused acceleration story. Every layer remains available for manual refinement, assistant edits and repeatable production.
HOW IT WAS MADE01 02 03
Structured as an editable JsonCut composition
Motion reviewed at opening, middle and closing frames
Rendered through the production browser runtime
EDITABLE JsonCut PROJECTUse the finished project.
Use the finished project.
Change every layer.
Loading editable JsonCut project…